Introduction
Power BI has become one of the most influential business intelligence tools in the modern data-driven world. It provides organizations with the ability to analyze data, derive meaningful insights, and make informed decisions. Developed by Microsoft, Power BI integrates seamlessly with numerous data sources and offers powerful visualization capabilities.
According to a Gartner report, Power BI has been recognized as a leader in the Magic Quadrant for Analytics and Business Intelligence Platforms for several years. As of 2024, Power BI holds a significant market share in business intelligence tools, with over 250,000 companies worldwide using it. The tool is widely preferred due to its affordability, robust integration capabilities, and user-friendly interface. Power BI is extensively used across various industries, including finance, healthcare, retail, manufacturing, and education, demonstrating its versatility in handling diverse data analytics challenges.
Power BI is a powerful business analytics tool that helps organizations visualize data, generate insights, and make informed decisions. Businesses across industries use Power BI for real-time reporting, financial analysis, sales performance tracking, and predictive analytics. From healthcare to finance and e-commerce, its applications are vast.
One of India’s best IT companies, True Value Infosoft, specializes in cutting-edge software and mobile app development. With expertise in Power BI integration, True Value Infosoft helps businesses unlock the full potential of their data. The company’s commitment to innovation makes it a trusted choice for enterprise solutions in India.
What is Power BI?
Power BI is a business analytics service by Microsoft that enables users to visualize data, create reports, and share insights across an organization or embed them into an application or website. It transforms raw data into interactive dashboards and reports, making it easier for organizations to identify patterns and trends.
Power BI connects to various data sources, including databases, Excel files, cloud-based applications, and on-premises servers. It allows users to create dynamic reports, automate data updates, and utilize AI-driven analytics for improved decision-making.
Components and Key Features of Power BI
Power BI consists of several components, each designed for specific functions. These components work together to create a seamless data visualization and analysis experience.
Components of Power BI:
- Power BI Desktop – A free application for creating reports and dashboards.
- Power BI Service – A cloud-based service for sharing reports and dashboards.
- Power BI Mobile – A mobile application for viewing and interacting with reports.
- Power BI Report Server – An on-premises solution for publishing and managing reports.
- Power BI Embedded – A solution for developers to embed Power BI reports into applications.
Key Features of Power BI:
- Data Connectivity – Connects to multiple data sources, including SQL Server, Azure, Google Analytics, and more.
- AI-Powered Insights – Uses AI and machine learning to provide predictive analytics.
- Interactive Dashboards – Allows users to create interactive dashboards and reports with drag-and-drop functionality.
- Custom Visualizations – Offers a variety of built-in and custom visualizations to enhance data representation.
- Data Modeling – Enables users to create relationships between datasets and perform complex calculations.
- Real-Time Analytics – Supports real-time data streaming for instant insights.
- Collaboration & Sharing – Allows teams to share reports securely via the cloud.
- Security & Compliance – Provides enterprise-grade security with role-based access control.
Common Power BI Use Cases
Power BI is used across various industries and functions to improve data-driven decision-making. Here are some of the most common use cases:
Here’s a structured chart representing Common Power BI Use Cases:
| Industry | Use Cases in Power BI |
|---|---|
| 1. Finance & Accounting | Financial reporting, budget analysis, risk management, fraud detection |
| 2. Sales & Marketing | Sales performance tracking, customer segmentation, campaign analysis |
| 3. Healthcare & Pharmaceuticals | Patient data analysis, hospital performance metrics, drug inventory tracking |
| 4. Retail & E-commerce | Customer behavior analysis, sales forecasting, inventory management |
| 5. Human Resources (HR) | Employee performance tracking, workforce analytics, attrition prediction |
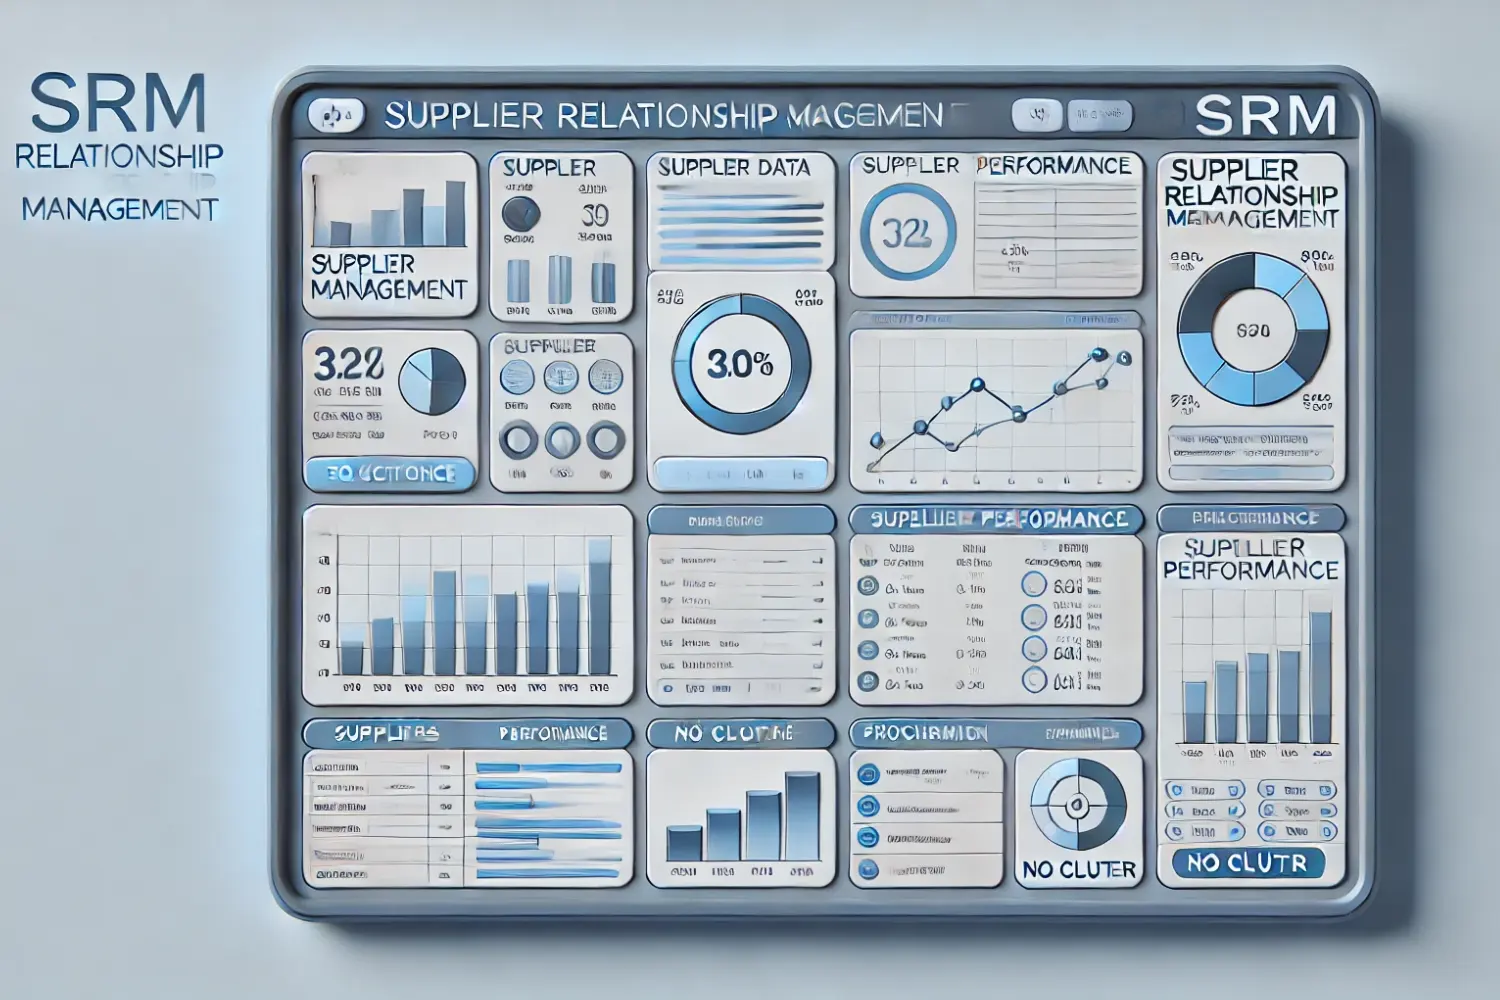
| 6. Manufacturing & Supply Chain | Production efficiency, demand forecasting, supplier performance analysis |
| 7. Education | Student performance tracking, institutional analytics, course effectiveness evaluation |
1. Finance & Accounting
- Financial Reporting – Automates financial reports, including profit and loss statements.
- Budgeting & Forecasting – Uses historical data for predictive financial modeling.
- Risk Analysis – Assesses financial risks using real-time data analytics.
2. Sales & Marketing
- Sales Performance Tracking – Monitors key sales metrics such as revenue and conversion rates.
- Customer Segmentation – Analyzes customer behavior for targeted marketing strategies.
- Campaign Effectiveness – Evaluates the impact of marketing campaigns in real time.
3. Healthcare & Pharmaceuticals
- Patient Data Analytics – Tracks patient demographics, diseases, and treatment effectiveness.
- Operational Efficiency – Helps in optimizing hospital operations and resource allocation.
- Drug Sales & Distribution – Analyzes pharmaceutical sales trends.
4. Retail & E-commerce
- Inventory Management – Optimizes stock levels and reduces wastage.
- Customer Behavior Analysis – Tracks buying patterns and preferences.
- Sales Forecasting – Predicts future sales trends.
5. Human Resources (HR)
- Employee Performance Analytics – Tracks employee KPIs and productivity.
- Diversity & Inclusion Tracking – Monitors diversity and inclusion metrics.
- Workforce Planning – Analyzes staffing needs and workforce trends.
6. Manufacturing & Supply Chain
- Production Efficiency – Analyzes production workflows for optimization.
- Supply Chain Optimization – Identifies inefficiencies in logistics and procurement.
- Quality Control – Detects defects and maintains product standards.
7. Education
- Student Performance Analysis – Tracks academic performance trends.
- Resource Allocation – Analyzes school or university expenditures.
- Course Enrollment Trends – Monitors popular courses and student preferences.
Who Can Use Power BI?
Power BI is designed for a wide range of users, from beginners to advanced data analysts. The following professionals and teams can benefit from Power BI:
- Business Analysts – Use Power BI for trend analysis and performance measurement.
- Data Analysts & Scientists – Conduct in-depth data analysis and machine learning predictions.
- Finance Teams – Generate financial reports and forecasts.
- Marketing Teams – Track campaign performance and customer insights.
- HR Professionals – Monitor employee engagement and workforce planning.
- Executives & Managers – Access high-level dashboards for strategic decision-making.
- IT Professionals – Manage data security and integration with enterprise systems.
Importance of Power BI in Visualization and Analysis
Data visualization is a crucial aspect of business intelligence, and Power BI plays a significant role in transforming raw data into meaningful insights. The importance of Power BI in visualization and analysis includes:
- Enhanced Decision-Making – Provides clear, data-driven insights for strategic planning.
- Time Efficiency – Automates report generation, reducing manual workload.
- Improved Accuracy – Ensures data integrity through real-time analytics.
- User-Friendly Interface – Allows non-technical users to create dashboards easily.
- Predictive Analytics – Leverages AI for forecasting future trends.
- Scalability – Suitable for both small businesses and large enterprises.
- Integration with Other Tools – Connects seamlessly with Excel, SQL, Azure, and more.
Companies Using Power BI
Many leading companies across different industries rely on Power BI for data analysis and reporting. Some of these companies include:
- Microsoft – Uses Power BI for internal analytics.
- Amazon – Implements Power BI for e-commerce analytics.
- Coca-Cola – Leverages Power BI for supply chain optimization.
- Walmart – Uses Power BI for retail data analysis.
- Nestlé – Implements Power BI for production efficiency.
- Johnson & Johnson – Utilizes Power BI for healthcare data visualization.
- T-Mobile – Uses Power BI for customer insights and network performance.
- Adobe – Leverages Power BI for marketing and sales analytics.
- Procter & Gamble – Uses Power BI for business performance analysis.
- General Electric – Implements Power BI for industrial analytics.
Conclusion
Power BI is a powerful tool that empowers businesses with data-driven insights. With its robust visualization capabilities, ease of use, and integration with various data sources, Power BI is revolutionizing how organizations analyze and interpret data. Whether you are in finance, healthcare, sales, or manufacturing, Power BI provides a scalable and efficient solution for business intelligence needs.
FAQs
Power BI is a business analytics tool developed by Microsoft that allows users to visualize data, generate reports, and gain insights from various data sources. It works by connecting to multiple data sources (Excel, databases, cloud services, etc.), transforming and modeling data using Power Query, and then creating interactive dashboards and reports.
Power BI consists of the following key components:
- Power BI Desktop – A Windows-based application for report creation and data modeling.
- Power BI Service – A cloud-based service for publishing and sharing reports.
- Power BI Mobile – Mobile apps for viewing reports on iOS and Android devices.
- Power Query – A data transformation tool.
- Power Pivot – A data modeling tool.
- Power BI Gateway – A connector that enables data refresh from on-premise sources.
While both Power BI and Excel are used for data analysis, Power BI is more advanced in terms of visualization, automation, and scalability. Power BI allows for interactive dashboards, real-time data updates, and integration with multiple data sources, whereas Excel is mainly used for spreadsheet-based data analysis.
Power BI offers both free and paid versions:
- Power BI Desktop (Free) – Allows users to create reports and dashboards.
- Power BI Pro (Paid) – Costs $10 per user/month and enables collaboration, sharing, and advanced analytics.
- Power BI Premium (Paid) – Designed for enterprises, providing dedicated cloud resources and enhanced performance.
Power BI supports a wide range of data sources, including:
- Excel files
- SQL Server
- Azure services
- Google Analytics
- Salesforce
- SharePoint
- APIs and web services
- And many more!


